
Imagine running a factory that pumps out smoke every day. You know that smoke hides gases and warms the planet. Now picture the EPA knocking on your door, asking for proof of what you’re emitting. That’s the reality for many businesses under U.S. rules. Accurate greenhouse gas reporting keeps you out of trouble and shows you care about the environment. This guide walks you through how to calculate those emissions step by step. It targets plant managers, compliance officers, and owners in heavy industries. Get this right, and you avoid fines while building trust with regulators and the public. The process seems tough at first, but with clear steps, it’s doable.
Understanding the EPA Greenhouse Gas Reporting Program (GHGRP) Framework
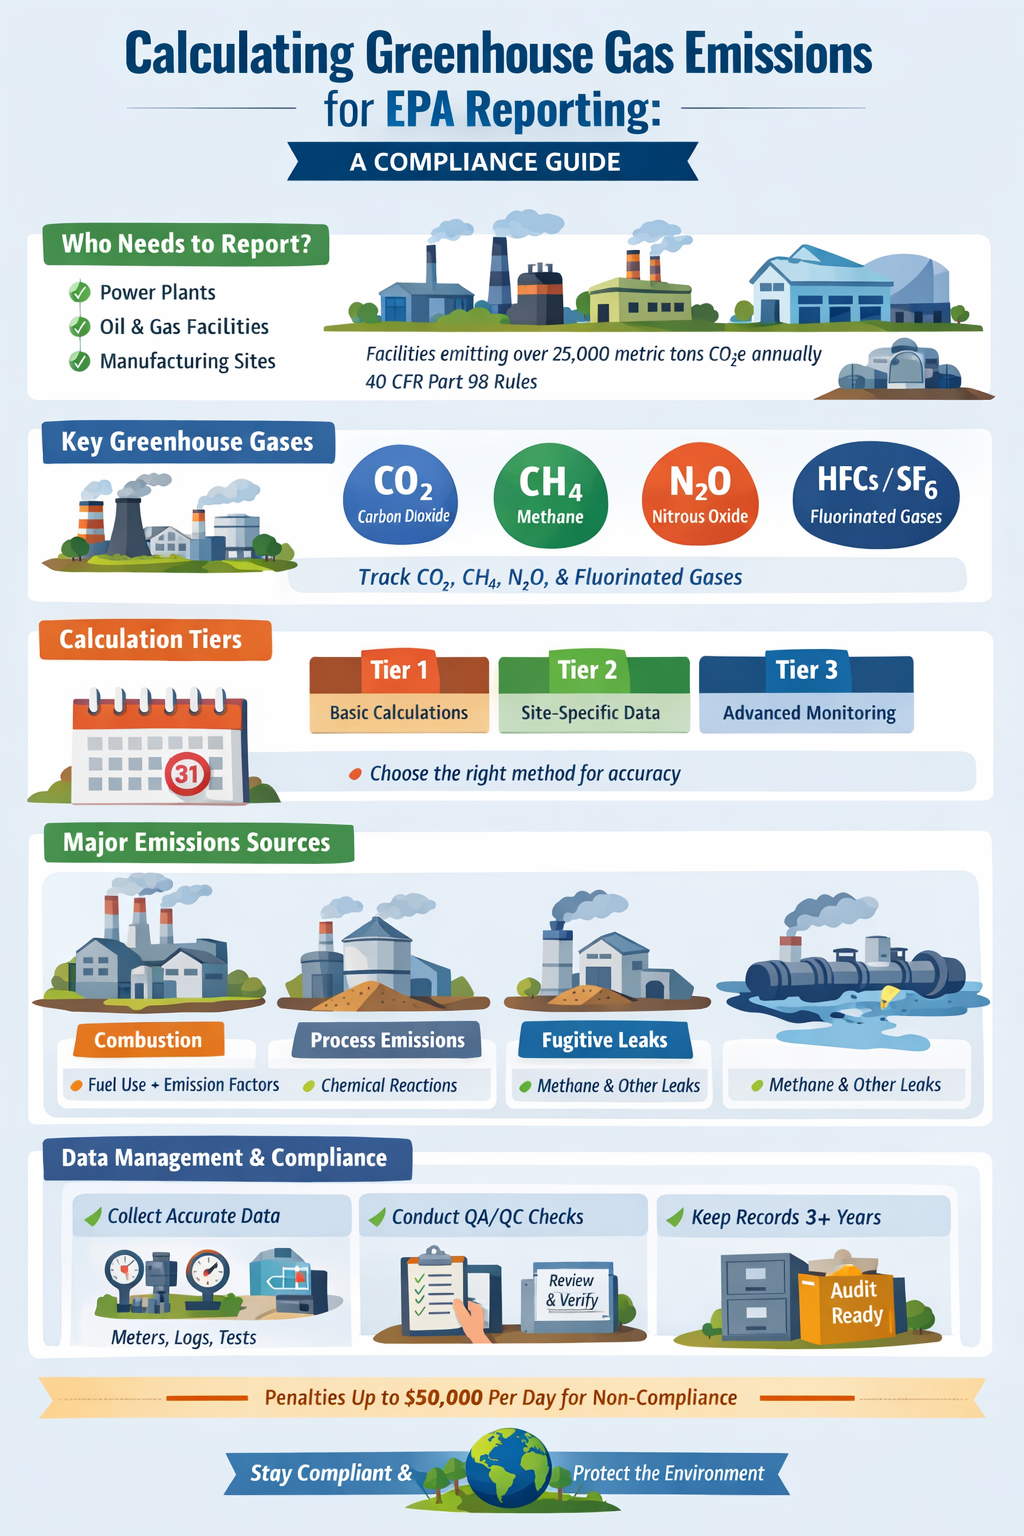
The GHGRP sets rules for tracking and reporting emissions from big sources across the U.S. It started in 2010 and covers facilities that release over 25,000 metric tons of CO₂ equivalent each year. This program helps the government build a full picture of national emissions to fight climate change.
1. Scope and Applicability: Who Must Report Emissions?
You need to report if your site hits certain limits. For example, power plants with over 25,000 tons of CO₂ equivalent from burning fuel must comply. The same goes for cement makers, oil refineries, and electronics plants that use fluorinated gases. Check 40 CFR Part 98 for exact rules. Small farms or offices usually skip this, but large operations in listed sectors can’t. Thresholds vary by gas and process—say, 25,000 tons for CO₂ from combustion. Always verify your site’s total against these marks to know if you’re in.
- Power generation: High fuel use triggers reporting.
- Manufacturing: Look at chemical outputs and waste.
- Oil and gas: Include leaks and flaring.
Missing the threshold? You still might report under subparts for specific risks. The EPA updates these yearly, so stay current.
2. Defining Emissions Sources and GHGs Covered
GHGRP focuses on direct emissions from your operations. These are Scope 1 sources, like burning fuel in boilers or leaks from pipes. Indirect ones, such as power bought from the grid, often fall outside unless specified.
The main gases include the following:
- Carbon dioxide (CO₂) from fuel combustion.
- Methane (CH₄) from leaks or waste.
- Nitrous oxide (N₂O) from processes like nitric acid making.
- Fluorinated gases, such as hydrofluorocarbons (HFCs), perfluorocarbons (PFCs), and sulfur hexafluoride (SF₆), are used in coolers and switches.
CO₂ makes up most reports, but CH₄ packs a bigger punch per ton—about 25 times that of CO₂ over 100 years. Track all to get the full CO₂ equivalent. This setup ensures you cover the biggest climate threats from your site.
3. Key Reporting Deadlines and Submission Platforms
Reports go in once a year. Most facilities submit by March 31 for the prior calendar year. Some sectors, like electronics, have extensions to June. Miss it, and you face audits or penalties up to $50,000 per day.
Use the EPA’s e-GGRT system online. It’s secure and tracks your data. Register early if new; it takes time to set up. Upload calculations, supporting files, and certifications there. The platform flags errors before you hit send. Prep your data in spreadsheets to make entry smooth. In 2025, the EPA added new tools for easier uploads, cutting time by half for many users.
Foundational Calculation Methodologies for EPA Compliance
Start with solid methods to match EPA rules. Wrong choices lead to rejected reports or fines. Pick based on your site’s size and tech.
-
Tiered Approach: Selecting the Appropriate Calculation Method
EPA uses three tiers for accuracy levels. Tier 1 suits simple sites; it multiplies fuel use by set emission factors. Think small boilers burning natural gas.
Tier 2 steps up with site-specific data, like from stack tests. Refineries often pick this for better precision on CO₂ and CH₄. Tier 3 goes deepest, using direct measures or chemical balances. Large chemical plants rely on it for complex reactions.
- Tier 1: Easy, but less exact—great for startups.
- Tier 2: Balances cost and detail—common in manufacturing.
- Tier 3: Most accurate, but pricey—for high-stakes ops.
Match your tier to subpart rules. Power plants lean toward Tier 2 with monitors. Always document why you chose it. Upgrading tiers can lower uncertainty, but start simple if allowed.
-
Utilizing EPA-Approved Emission Factors (EFs)
Stick to the EPA’s latest factors for reliable numbers. These come from lab tests and field data, updated in tools like the AP-42 manual.
For CO₂ from natural gas, use 53.02 kg per million Btu. CH₄ factors sit at 0.033 kg per million Btu for the same fuel. Pull them from epa.gov/ghgreporting or linked databases. Avoid old versions—2025 updates cut CH₄ estimates for some fuels by 10%.
Apply them like this: Multiply your fuel input by the factor, then convert to CO₂ equivalent using global warming potentials (GWPs). GWPs come from IPCC reports, endorsed by the EPA—CO₂ is 1; CH₄ is 28 over 100 years. Test your math with sample calcs from EPA guides. This keeps your report defensible.
-
Calculating Fluorinated Gas Emissions (HFCs, PFCs, SF₆)
These gases trap heat thousands of times better than CO₂. Track them by use, not burn—think AC refills or switchgear leaks. EPA requires annual consumption data.
Use this basic formula: Emissions = (Charge amount × Leak rate) + (Disposal emissions × GWP). For HFCs in fridges, if you add 100 kg yearly and leak 10%, that’s 10 kg emitted. Multiply by GWP—say, 1,300 for a common HFC—to get CO₂ equivalent.
Check Subpart I for details on electronics or Subpart O for industrial uses. Measure with scales or vendor receipts. High GWP means small leaks add up fast—a few kg of SF₆ equals tons of CO₂. Log every top-off to avoid undercounts.
Detailed Calculation Procedures for Major Emission Categories
Break emissions into types for clear math. Each needs its own approach, but all tie back to real data.
1. Calculating Emissions from Stationary Combustion Sources
Burning fuel in engines or heaters creates most CO₂. Start with total fuel used, from meters or bills.
The formula is: Emissions (kg) = Fuel rate (mmBtu) × Carbon content × Oxidation factor × (1 / 1000 for tons). For coal, carbon content hits 25.8 kg C per mmBtu; oxidation is 0.98 kg.
- Natural gas: 117 lb CO₂ per million Btu—simple for boilers.
- Diesel: 161 lb per million Btu; adjust for sulfur.
- Biomass: Lower factors, but track moisture.
Convert units carefully—Btu to kg, then to metric tons. A plant burning 1 billion Btu of gas yearly emits about 53,000 tons of CO₂. Add CH₄ and N₂O traces using small factors. Verify with annual audits.
2. Quantifying Process Emissions
These come from reactions, not flames—like lime in cement kilns releasing CO2. Use mass balance: Input materials minus outputs equals emissions.
For ammonia plants, track N₂O from catalysts. Stoichiometry helps: one mole of fuel might yield set CO₂ moles. EPA tables give default ratios if you lack lab data.
Example: In lime production, if you calcine 100 tons of limestone (CaCO₃), expect 44 tons of CO₂ from the carbon part. Weigh inputs precisely. Subpart U covers cement; adjust for purity. This method catches hidden releases, vital for chemical sites.
3. Accounting for Fugitive Emissions (Methane Leaks)
Leaks slip out from seals and valves, mostly CH₄ in oil fields. EPA demands surveys under LDAR rules.
Count components, then apply leak rates—say 0.5% for valves. If 1,000 valves leak 1 kg of CH₄ each yearly, that’s a total of 1,000 kg. Multiply by 28 GWP for CO₂ equivalent: 28 tons.
- Quarterly checks: Use sniffers or optics.
- Repair logs: Track fixes to cut estimates.
- Models: EPA’s for subpart W guide offshore rigs.
In 2024, new tech dropped leak rates by 15% for compliant sites. Integrate with process data for full counts.
Data Management, Quality Assurance, and Recordkeeping
Good data drives trust. Messy records invite scrutiny. Build systems now to ease future reports.
1. Establishing Robust Data Collection Protocols
Gather data from reliable spots: fuel meters, scale tickets, and lab tests. Calibrate tools yearly to avoid drifts.
- Daily logs: Note meter readings at shift ends.
- Digital tracking: Use software for auto-exports.
- Vendor confirms: Match bills to usage.
Trace every number back—a CO₂ calc from bad fuel data fails audits. Train staff on protocols. This setup saves hours during year-end rushes.
2. Quality Assurance/Quality Control (QA/QC) Procedures
Review data twice before submitting. Check calcs against EPA samples; flag outliers. Run uncertainty checks: For Tier 1, it might hit 10-20%; for Tier 3, under 5%. Test with mock reports. Peer reviews catch math slips. Even if not required, these steps build confidence. In one case, QA spotted a 5% overcount from old factors, saving a firm $10,000 in credits.
3. Essential Documentation and Retention Requirements
Keep all for three years minimum per EPA. Include raw data, formulas, and QA notes. Store in secure files, labeled by date and source. Audits can hit anytime—have it ready. Digital backups prevent loss. This trail proves your work. It also helps if rules change, like the 2026 updates on methane.
Conclusion: Ensuring Long-Term GHGRP Compliance and Accuracy
Mastering EPA GHG reporting starts with knowing if you qualify and which gases to track. Pick the right tier, crunch numbers with fresh factors, and handle each source carefully—from combustion to leaks. Back it with strong data habits and checks to stay solid.
Penalties for errors top $40,000 daily, but compliance opens doors to green funding. As rules tighten—think more focus on methane in 2026—stay ahead with annual reviews. Your accurate reports not only meet the law but also cut real emissions. Dive into EPA resources today and start calculating. Your planet thanks you.
Simplify Your SDS Management
CloudSDS gives your team instant access to 23M+ safety data sheets with AI-powered search, automated updates, and full OSHA/GHS compliance — all from one platform.
Leave A Comment